About this Whitepaper
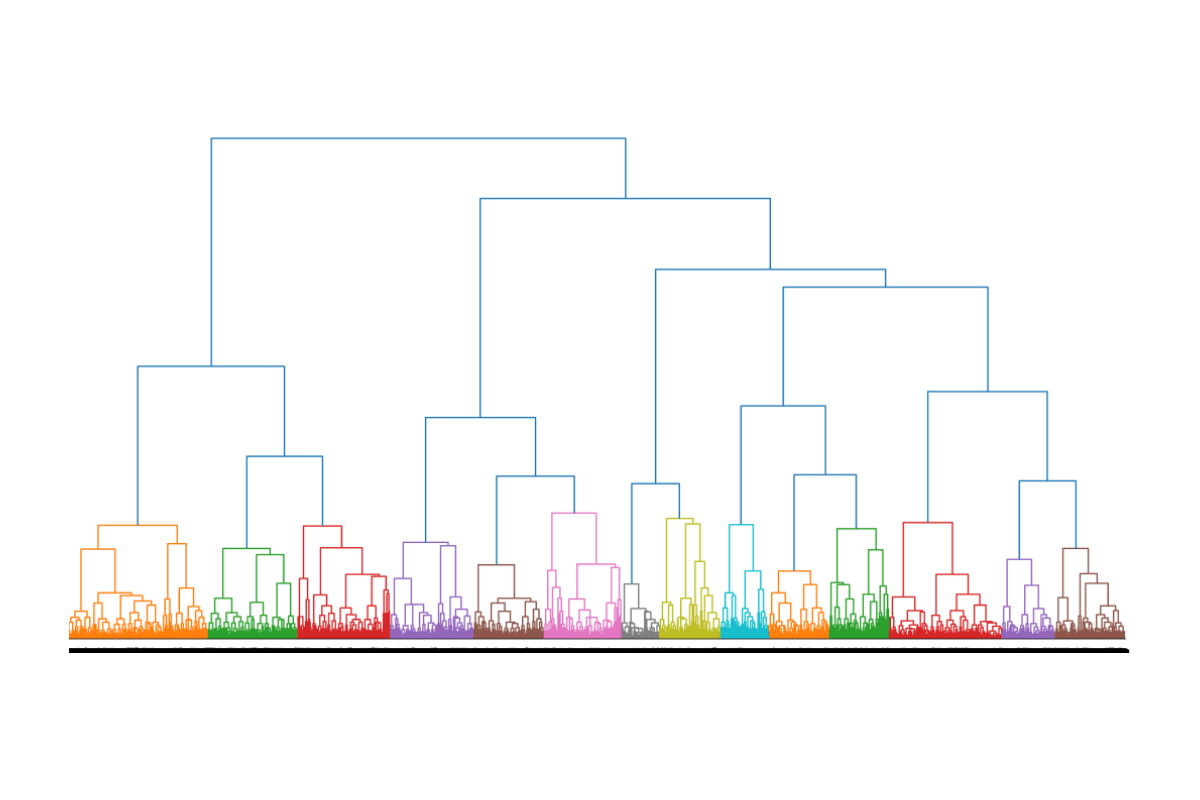
Researchers identifying patient profiles for autistic individuals typically find between 2-7 distinct groups. Here, we show how using a larger sample size and a broader set of clinically relevant variables allows us to identify more fine-grained clusters that better capture the spectrum nature of autism spectrum disorders. In turn, techniques that identify more diverse clusters may better inform precision behavioral healthcare initiatives.Cluster Combinations
In this study, we systematically analyzed clustering results from 48 combinations of:
Four sample sizes
- 40
- 395
- 3948
- 39475
Three sets of clinically relevant variables
- 7 medical/diagnostic features
- 31 behavioral features
- 50 total features
Four clustering algorithms
- agglomerative hierarchical
- BIRCH
- DBSCAN
- k-means
Clusters identified ranged 2-to-100 with a median of eight and average of 20. Increasing the sample size led to:
- No change in clusters identified (behavioral features)
- An increase in the number of clusters identified (medical/diagnostic features)
- Influenced clusters dependent on the algorithm (all features)
Download Whitepaper
Influence of Sample Size, Feature Set, and Algorithm on Cluster Analyses for Patients with Autism Spectrum Disorders Researchers
On Average
The greatest number and most well-defined clusters were identified with the medical/diagnostic features (58).
The fewest clusters were identified using behavioral features (6).
Lastly, on average, fewer clusters were identified using the BIRCH (18) and DBSCAN (15) algorithms than agglomerative hierarchical (24) and k-means algorithms (25).
In total, this study suggests that the patient sample size, specific feature set used, and the algorithm chosen for clustering will influence the number of clusters identified. The “right” number of clusters likely depends on how the information obtained through clustering analyses are practically used in clinical contexts. Download the Whitepaper


