Understanding the Current State of Applied Behavior Analysis

By: Dana D’Ambrosio, MS, BCBA, LBA
ABA practitioners discussing patient progress by hours per week

A summary of the webinar titled “Crack Open the Autism Black Box- Exposing unjustified inconsistencies in ABA therapy and what health plans can do about it” presented by RethinkFutures, October 2023

In a recent live webinar, Board Certified Behavior Analysts and Data Scientists from RethinkFirst and the RethinkFutures payor team delved into the complex landscape of Applied Behavior Analysis (ABA) and its connection with utilization review. The field of ABA faces challenges which, in turn, affect payors’ attempts to manage autism treatment, member progress, and outcomes.

Challenges in ABA Treatment

The challenges in ABA treatment were outlined, highlighting the absence of clear guidelines for prescribing treatment dosage (i.e., hours per week). Surprisingly, these critical factors aren’t taught in detail in most graduate programs and there is no published research literature to show how to translate a patient’s clinical presentation into specific hours of ABA. The recent surge in newly certified behavior analysts, with about 50% certified in the last five years1, adds complexity to the field. Many of these analysts gained their experience through telehealth during the pandemic, leading to a disconnect in traditional supervision and training practices.

The webinar discussed:

  1. lack of consensus within the ABA field on performance standards
  2. measurement of outcomes
  3. treatment quality

This absence of agreed-upon benchmarks and evaluation metrics complicates utilization review for insurance providers, leaving them to estimate progress, quality, and effectiveness of ABA service being provided.

Utilization Review Challenges

Utilization reviewers face the complex task of evaluating treatment plans, considering numerous variables such as symptom severity, comorbidity, treatment goals, age, and treatment duration spanning dozens of pages within a treatment plan. The difficulty lies in objectively determining if the care aligns with medical necessity and, if so, how many hours of treatment are appropriate. Payors also need to consider variability in treatment quality across their provider network such as with lack of individualization in treatment plans, undertreatment and overtreatment, and unclear member progress. All of which may ultimately lead to waste of healthcare resources and increased overall healthcare costs.

Data as a Solution

Data from service delivery can be used to identify key areas in ABA treatment variability and utilization review. In the webinar, the Rethink Team showed how collecting and analyzing data at the right levels of aggregation, across sessions, treatment phases, and in turn rolled up to the individual provider or organizational level helps identify inconsistencies and lead to more effective interventions. Data in the aggregate can help build evidence for the patient that the provider is executing therapy in an effective manner that leads to validated progress. By leveraging data, stakeholders have an opportunity to identify optimal pathways to maximize patient outcomes.

Variability in ABA Hours

Rethink’s data science team conducted a study based on provider data on ABA treatment hours for 14,748 individual patients. The result: 40% of those patients were being either overtreated or undertreated. This means the progress and long-term outcomes of 5,900 children were impacted because of inaccurate hours of ABA therapy. Overtreatment led to an average increase in cost per patient per year of $68,978 and undertreatment led to a reduction in patient progress by up to 72% of the potential progress they could have made.

The 40% statistic is similar to what has been measured in other areas of medicine regarding inaccurate treatment levels and, of note, the data scientists did not find any association between hours of ABA received and the patient’s individual clinical profile (i.e., patient cluster). There wasn’t a simple and clear clinical and data-based rationale that explained why patients were receiving such large differences in numbers of hours of ABA.

AI-Driven Solutions

The speakers discussed AI-driven solutions to address treatment variability. They presented a patent pending, evidence-based AI engine that combines expert knowledge of the variables that influence patient outcomes and Rethink’s expansive dataset on over 270,000 individuals to determine exactly how those variables should influence recommended hours. This Clinical Decision Support engine identifies patient clusters, predicts patient progress, provides recommendations for hours of ABA therapy, and flags areas of concern at the patient and provider levels.

Rethink’s data consists of over 70 million hours of ABA sessions and over half a million data points on clinical progress and the database is continuously growing. With that data, the team has identified over 70 different variables around patient characteristics, social determinants of health, and related characteristics that allow RethinkFirst to precisely predict patient progress and recommend the hours of ABA likely to optimize progress for each individual patient based on their total clinical profile.

The graphs below show dose response curves from three example patients where the optimal amount of progress is predicted. These curves highlight that receiving additional hours beyond the recommendation will provide little to additional no progress for that specific patient and, importantly, how receiving hours below that optimal prediction will negatively affect patient progress.

graphs of Predicted Progress by ABA hours per week

Hours Recommended:
Patient A = 11
Patient B = 26
Patient C = 40

*Dose response curve represents a single patient profile. Hours recommended within this curve are not applicable to entire patient population.

Clinicians and health plans are using Rethink’s Clinical Decision Support tool to bring consistency to hours recommendations and data collection with the goal of optimizing patient outcomes.

Examples of ABA Variability

Examples of variability in what providers work on in ABA were also explored. More detailed findings will be published in a white paper in November 2023. In the webinar, the data scientists showed how the content of therapy changes over time such as how an increasing number of diagnoses is associated with a need for more customized material.

As another example, as age increases, treatment plans have less focus on targets that fall into “listening and understanding” and greater focus on “relating to others”.

percentage graph of people interested in different activities by age

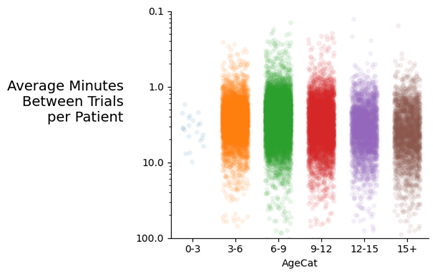
The data also showed extreme variability in rate of trial presentation among providers with some patients being presented with less than one minute between and others with trials being presented well over 10 minutes between trials. This variability is the difference between 60 versus 6 learning opportunities in one-hour of an ABA session.

dot plot average minutes between trials per patient age group

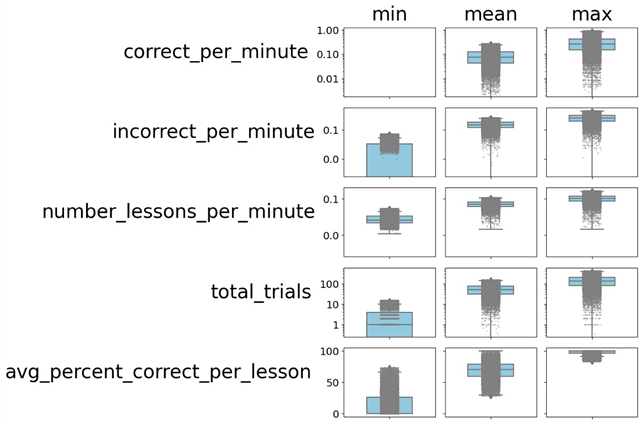
The final example of variability represented each individual patient within Rethink’s dataset across the number of correct responses per minute, incorrect responses per minute, number of different lessons presented per minute, total trials presented, and average percent correct per lesson.

In total, these might be considered a proxy for how challenging or difficult each session is for a patient. As with trial rates, these metrics demonstrate significant variability among providers in how they structure their sessions for patients.

chart showing min, mean, and max correct lessons per minute vs. total trials per minute

The quality measurement literature consistently demonstrates that significant variability in service delivery or patient outcomes is often an indication that care quality can be improved. Providing payors and providers with data around what a patient is doing during therapy, how often they’re asked to do it, and how successful they will likely lead to different ways to improve the quality of ABA services.

Improving Utilization Review

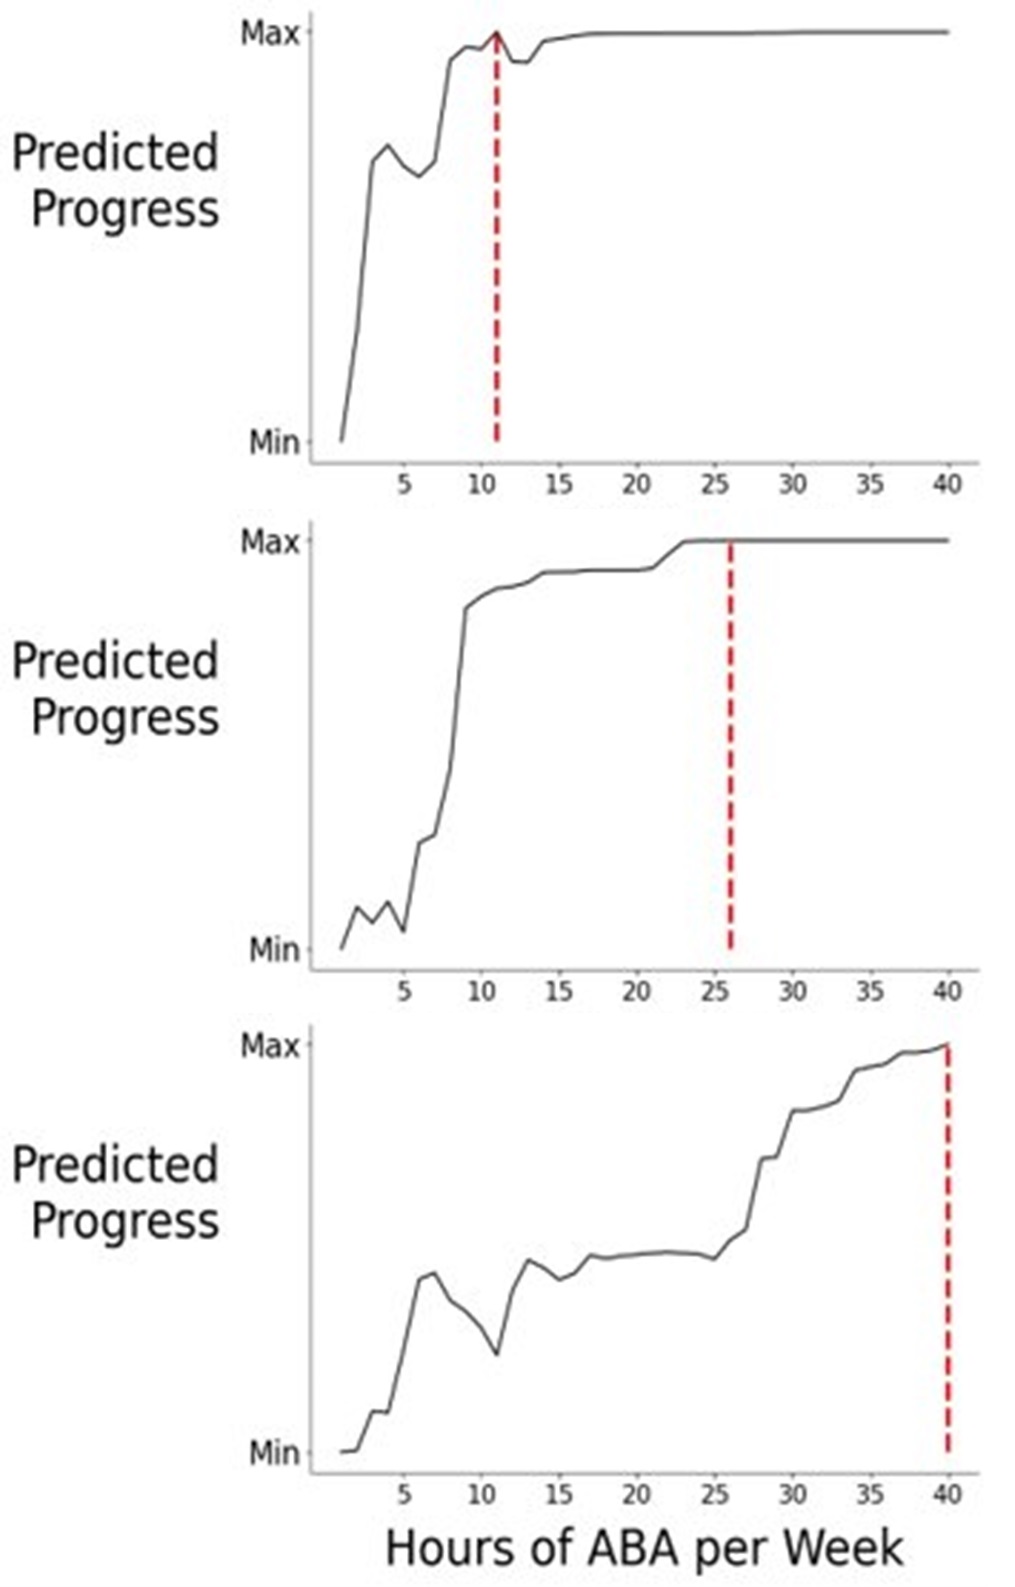
The presenters closed out the webinar by discussing how data-driven clinical decision support tools improve utilization review. These tools help payors and providers make complex treatment decisions based on objective data, focusing on the holistic well-being of the patient. By streamlining the prior authorization process and enhancing interrater reliability, utilization managers can make more informed decisions and payors can collaborate with their providers to improve network performance.

Conclusion

The live webinar shed light on several current complexities and challenges within the field of Applied Behavior Analysis. With data-driven solutions and advanced analytics:

  1. provider variability can be improved, where doing so would improve patient outcomes
  2. the utilization review process can be streamlined
  3. provider networks can be optimized

By leveraging data, the ABA field will move toward more consistent and effective care, benefiting both patients and providers while ensuring optimal utilization of healthcare resources.

View Webinar “Crack Open the Autism Black Box”


References:

  1. Behavior Analyst Certification Board. (2023). US employment demand for behavior analysts 2010-2022. Littleton, CO: Author US Employment Demand for Behavior Analysts (bacb.com)
  2. Ooi K. (2020). The Pitfalls of Overtreatment: Why More Care is not Necessarily Beneficial. Asian bioethics review, 12(4), 399–417. https://doi.org/10.1007/s41649-020-00145-z
  3. Lyu, H., Xu, T., Brotman, D., Mayer-Blackwell, B., Cooper, M., Daniel, M., Wick, E. C., Saini, V., Brownlee, S., & Makary, M. A. (2017). Overtreatment in the United States. PloS one, 12(9), e0181970. https://doi.org/10.1371/journal.pone.0181970
  4. Committee on the Learning Health Care System in America; Institute of Medicine; Smith M, Saunders R, Stuckhardt L, et al., editors. Best Care at Lower Cost: The Path to Continuously Learning Health Care in America. Washington (DC): National Academies Press (US); 2013 May 10. Available from: https://www.ncbi.nlm.nih.gov/books/NBK207225/ doi: 10.17226/13444
  5. Mullainathan S, Obermeyer Z. (2021). Diagnosing physician error: a machine learning approach to low-value health care. Quarterly Journal of Economics, 137(2), 679-727. doi:10.1093/qje/qjab046

About the Author

Headshot of Dana D’Ambrosio, MS, BCBA, LBA, Clinical Development for RethinkFutures

Clinical Development

Dana D’Ambrosio leads Clinical Development for RethinkFutures. She is a New York state licensed and Board-Certified Behavior Analyst. She brings over a decade of clinical knowledge, with experience spanning from direct patient care in various treatment settings to utilization and care management within the payor realm. She specializes in the creation and enhancement of technology solutions utilized by providers and health plans, to ensure best practice, high quality, coordinated care and streamlined review processes for all parties. She received a BS from the University of Central Florida and an MS degree in Counseling, specializing in Applied Behavior Analysis, from Nova Southeastern University.

Share with your community

Facebook
Twitter
LinkedIn

Sign up for our Newsletter

Subscribe to our monthly newsletter on the latest industry updates, Rethink happenings, and resources galore. Simply follow the link to the footer and enter your email.

Related Resources

Publication

About this Publication Past researchers have sought to describe and predict how individuals with autism...

eBook

About this eBook While every person diagnosed with autism and their family experiences their own...

Use Case

About this Use Case See how an AI driven ABA Applied Behavior Analysis Clinical Decision...